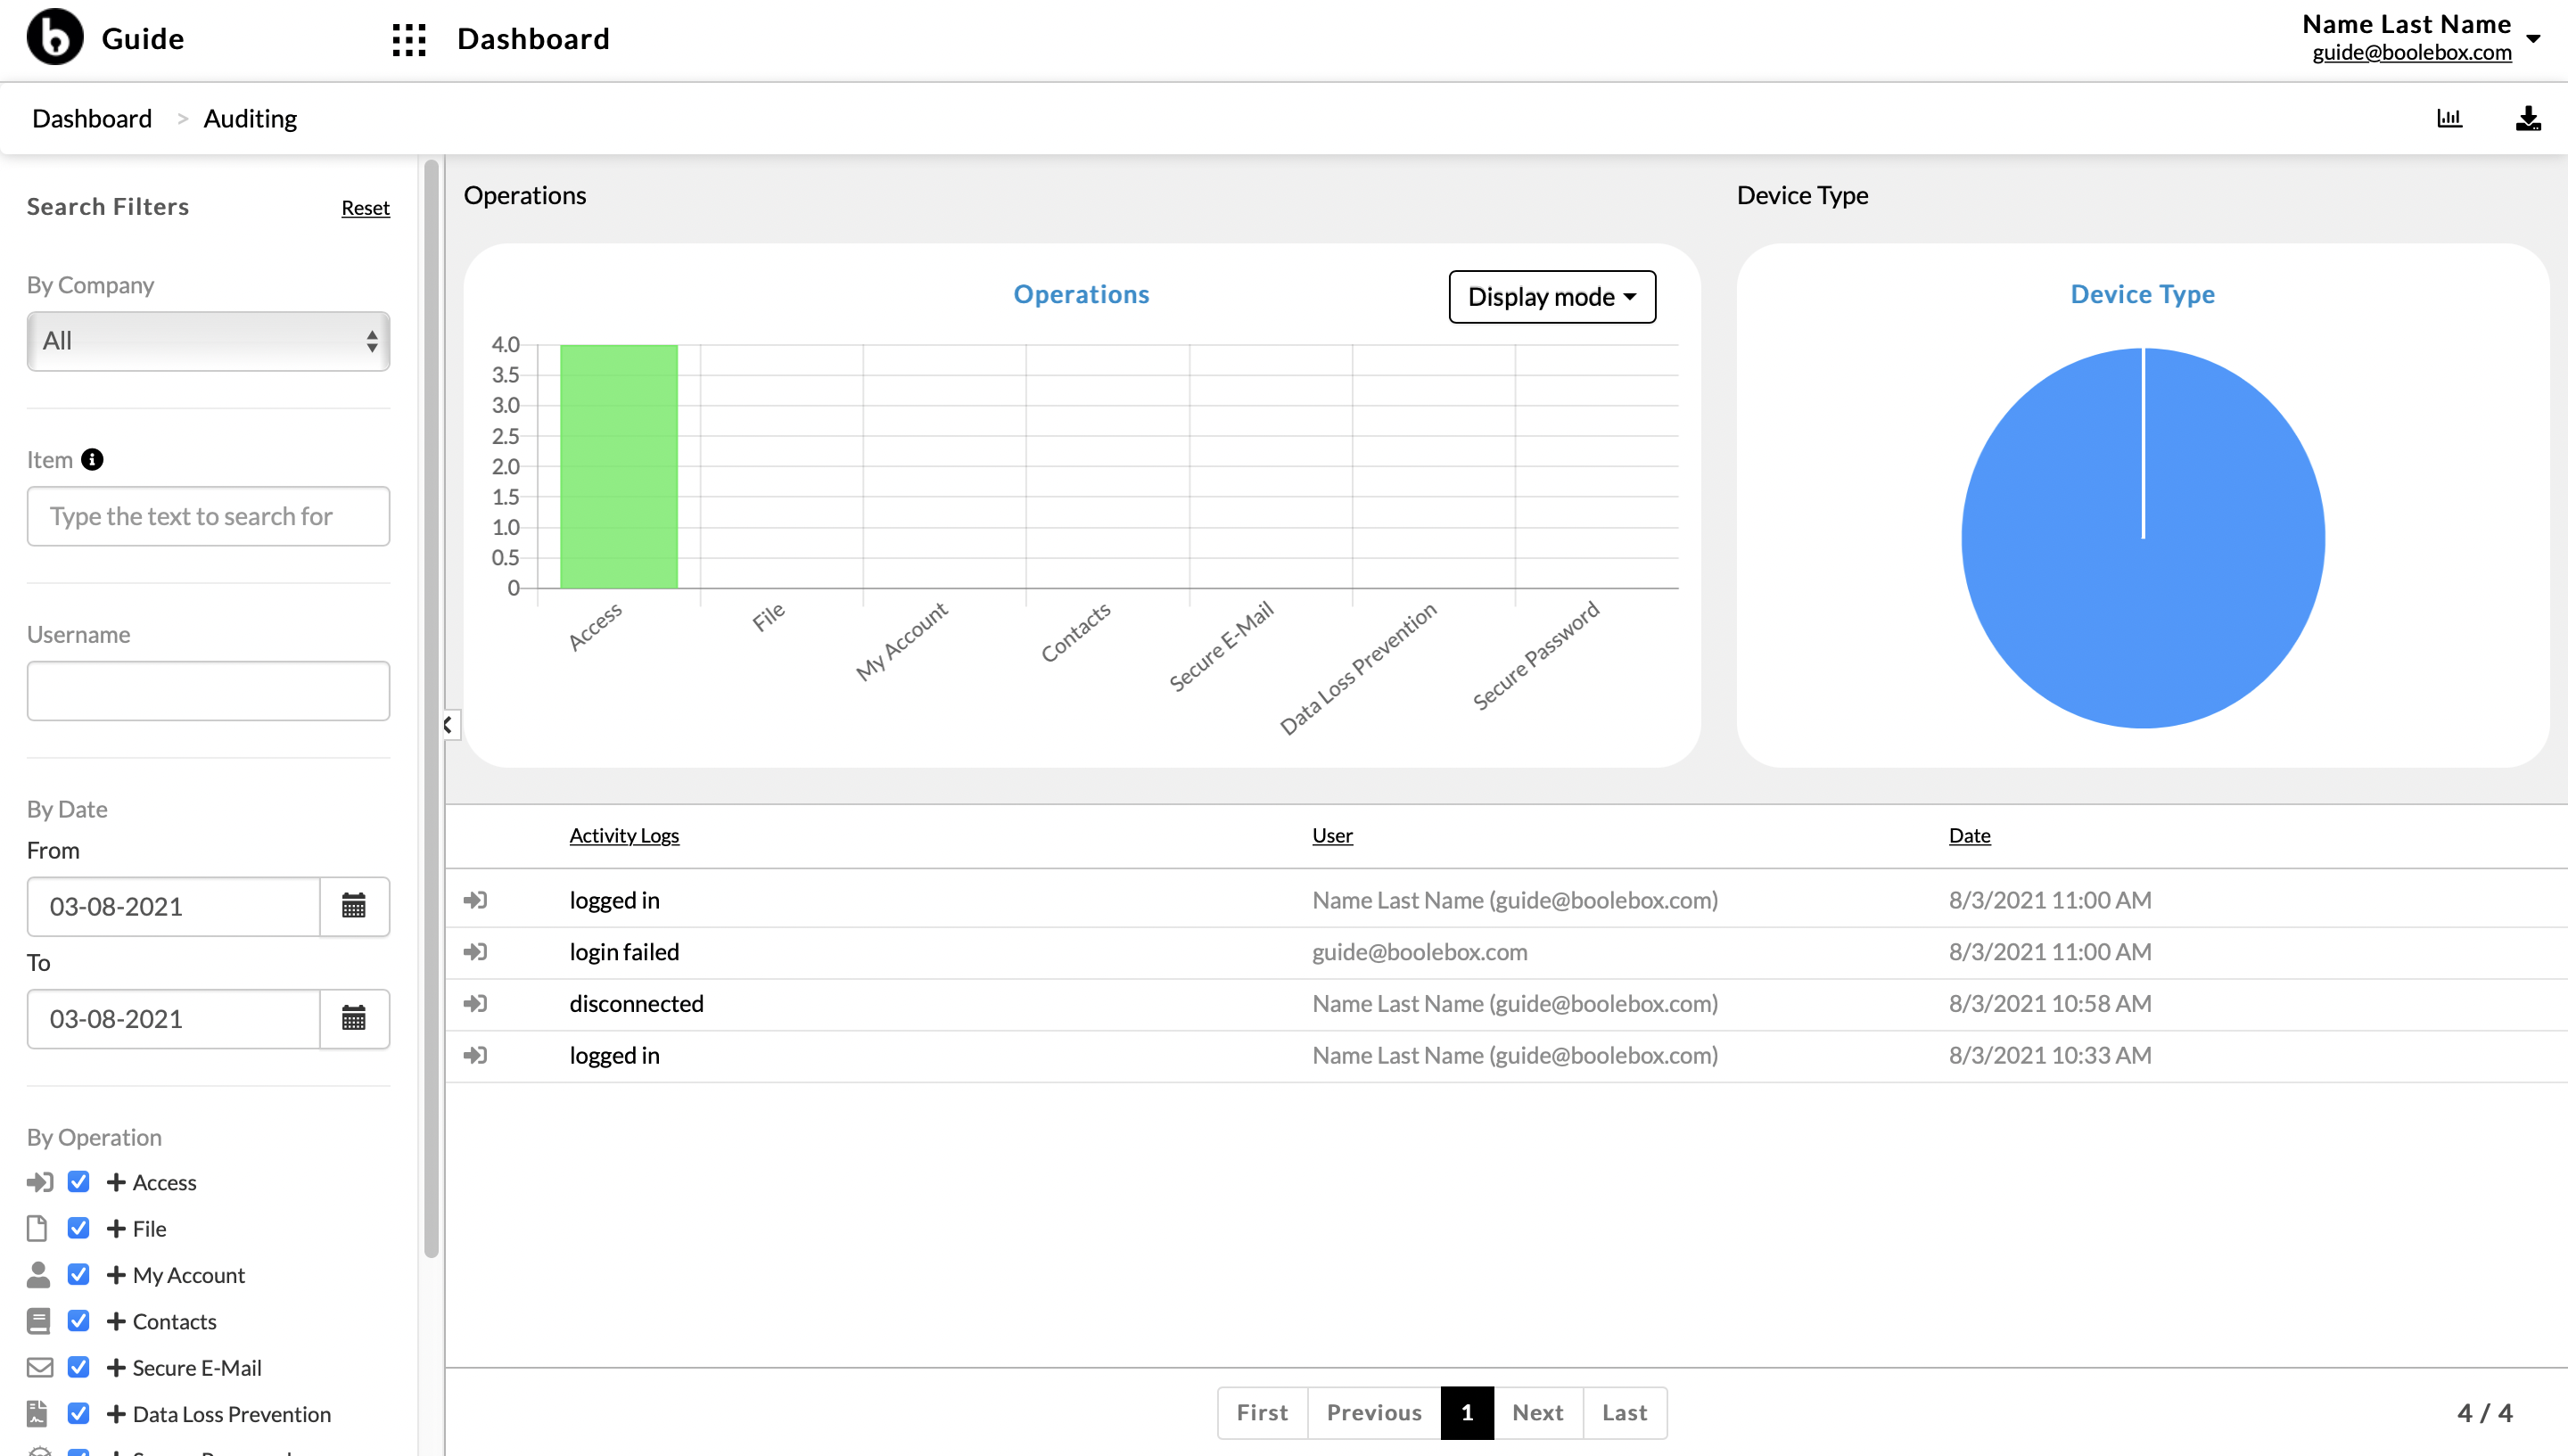
To give you a complete overview of the operations performed by users, BooleBox offers two convenient graphs built on the basis of the various actions traced by the platform. Specifically, the graphs on the main screen of the AUDITING section are two:
- OPERATION GRAPHIC – graphic that allows you to view the operations tracked.
- DEVICE TYPE GRAPHIC – graphic that allows you to view the type of device from which the tracked operations were performed.